


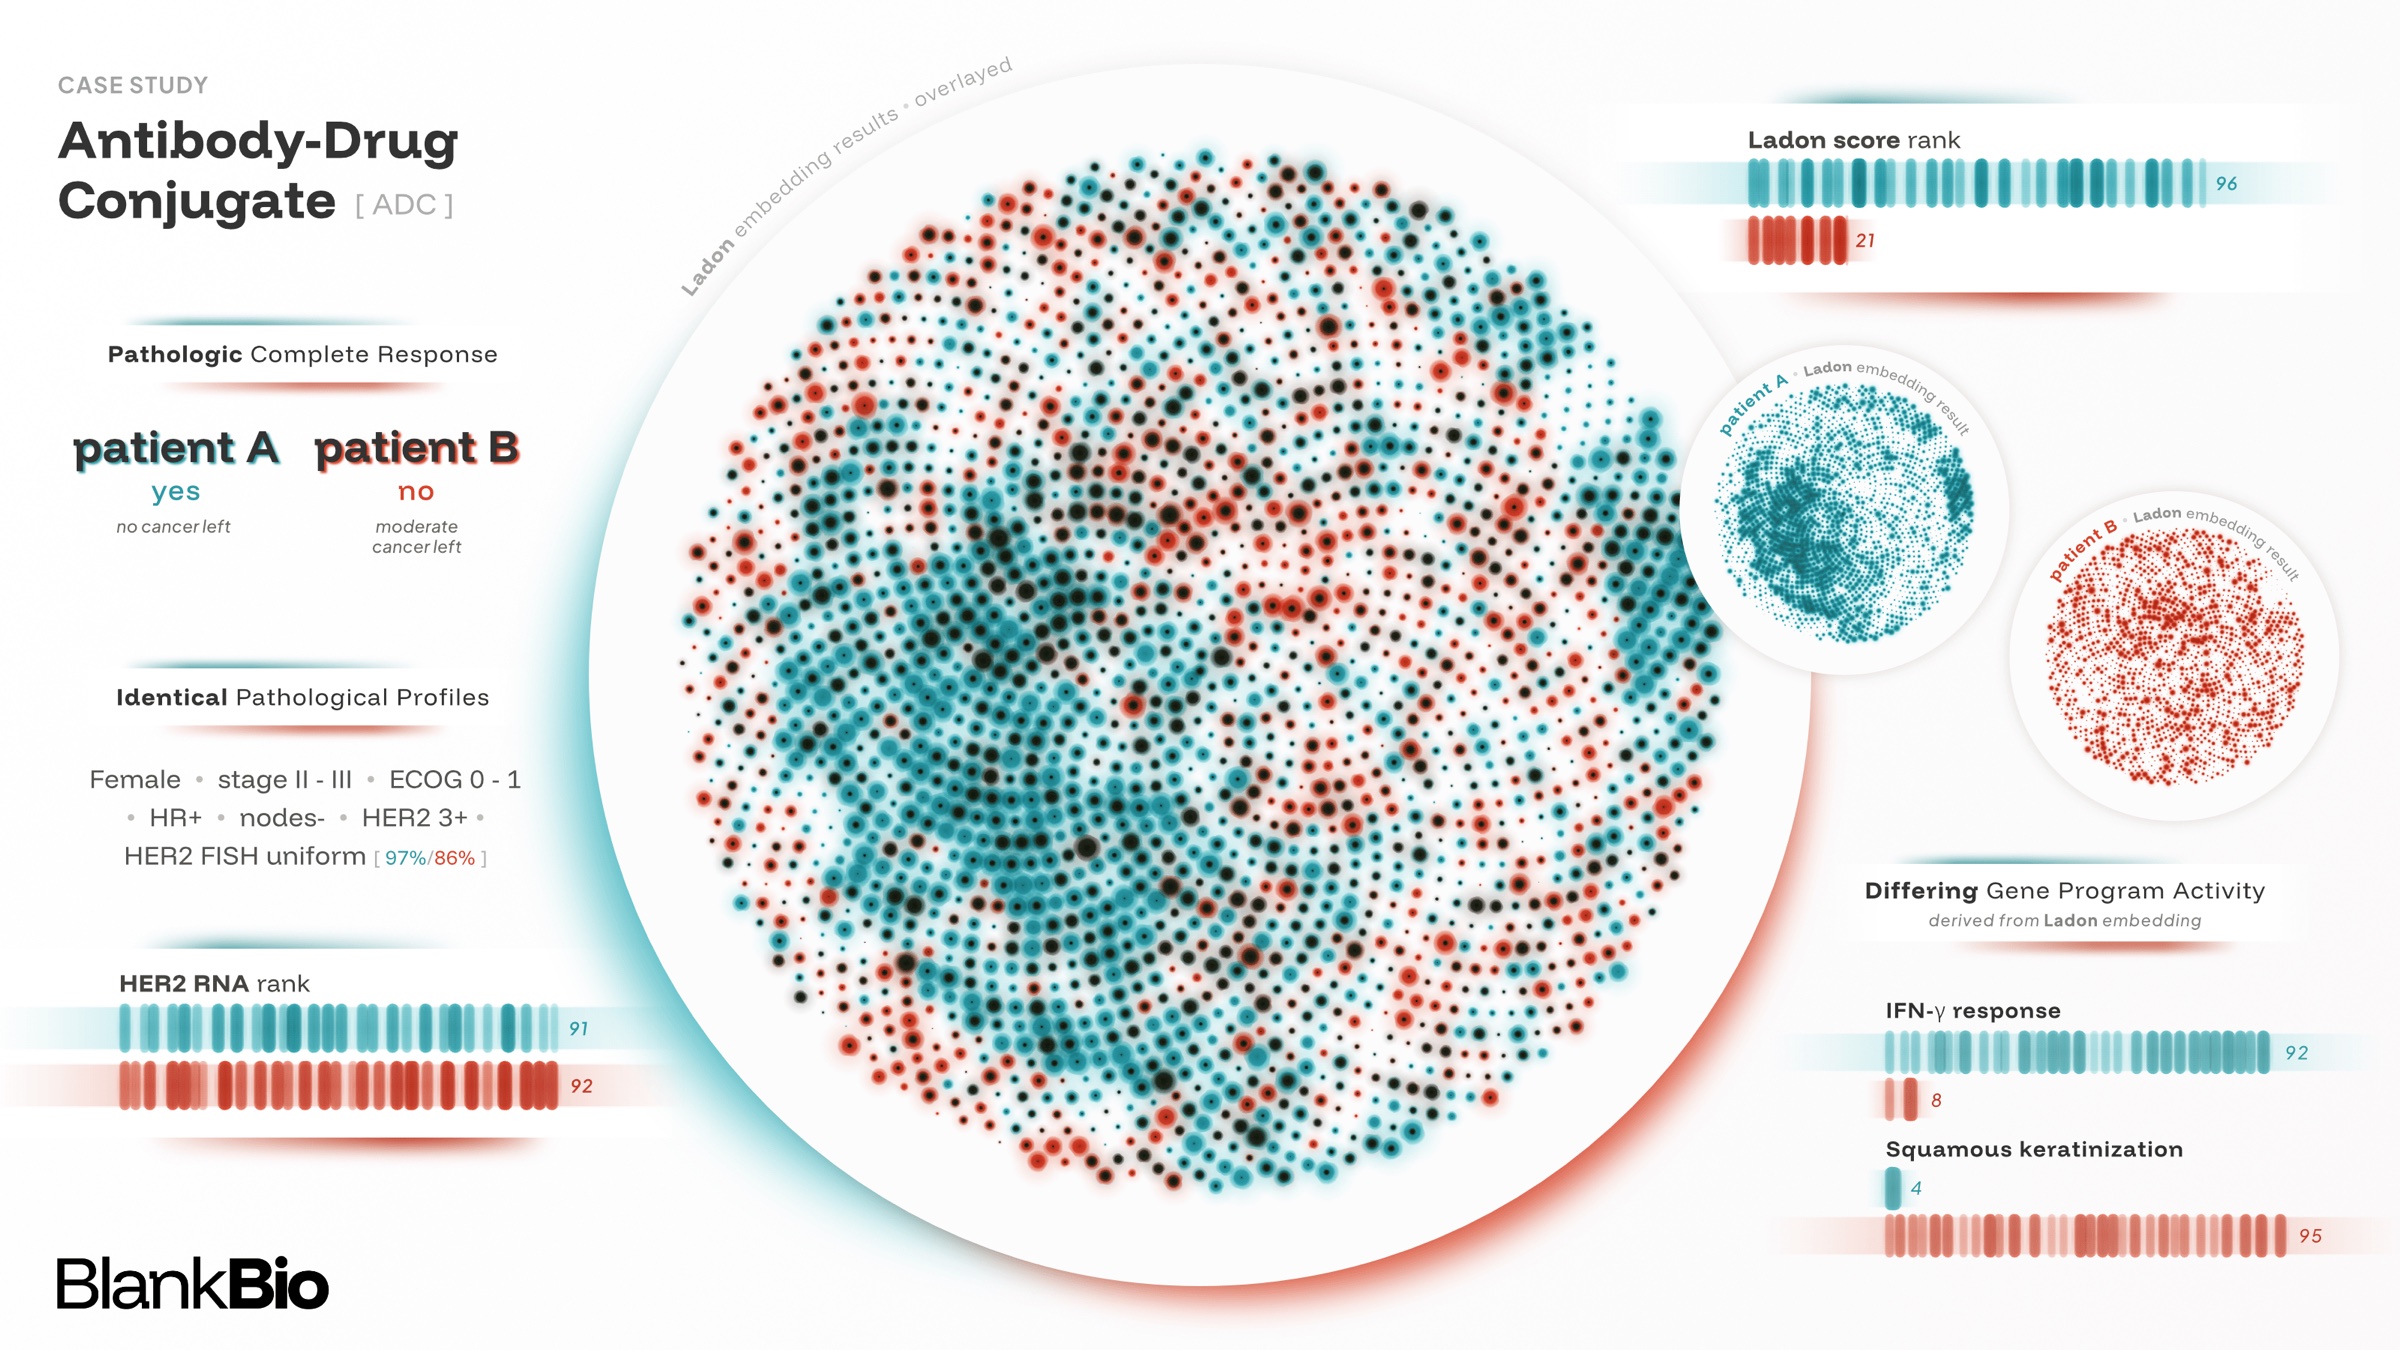
Blank Bio is excited to release Ladon, a transcriptomic foundation model trained on millions of bulk RNA-seq samples. Ladon allows for robust representations of RNA-seq, outperforming baseline gene expression and foundation model methods at prediction of prognosis and response on external validation cohorts.
Introduction
Despite the infinite complexity of the biology within every cancer patient, the decision today to give a drug rests at best on the measurement of a single gene. HER2 in breast cancer is the textbook example. Many breast tumors overexpress this receptor, and the antibody-drug conjugate trastuzumab deruxtecan targets them by attaching chemotherapy to an antibody against HER2. Eligibility depends on the tumor's HER2 immunohistochemistry score, but about half of qualifying patients with HER2-low tumors do not respond, and all face a risk of fatal lung toxicity (Modi et al., 2022). Meanwhile, the same score also excludes patients who benefit: trials kept finding benefit below the cutoff, which has now been lowered twice (Bardia et al., 2024). All of this assumes the score itself is even reliable, yet pathologists reading the same slides commonly disagree on the score (Fernandez et al., 2022). This is unfortunately the norm and not the exception: HER2 is one of oncology's best biomarkers, and others fare worse. PD-L1, the most widely used biomarker for immune checkpoint inhibitors, did not predict who benefited in most FDA approvals of these drugs (Davis & Patel, 2019).
Response and prognosis are driven by biology a single gene misses: the tumor's molecular subtypes, its immune context, and the programs driving proliferation, metastasis, and recurrence. Measured across every gene, RNA captures that biology. As early as in 1999, the first microarray studies already sorted tumors into clinically distinct classes by their expression (Golub et al., 1999). Since then, microarrays and then RNA-seq have profiled millions of patient samples from public consortia, hospital biobanks and clinical trials. A smaller but substantial fraction is paired with patient outcomes: survival, recurrence and response to treatment. No other molecular measurements in oncology are as widely collected and annotated. Yet after decades of this data, RNA informs only a few treatment decisions in the clinic.
The obstacle is not the signal, but transfer: gene expression based models predict outcome within the cohort they were trained on, but lose accuracy elsewhere. RNA-seq is notoriously sensitive to how it was generated. Sample handling, tissue preservation, library preparation and sequencing platform and tumor purity all leave their mark on the data, and they differ from cohort to cohort (Leek et al., 2010). Research studies keep these factors as uniform as possible by design to isolate a clear signal from one small cohort. A clinical test on the other hand must work across diverse patient populations and on samples from every hospital and testing lab. An RNA model for patients is therefore only as useful as its accuracy in cohorts it was never fit on.
Our core thesis is that this is exactly the problem foundation models solve. By pretraining on millions of samples spanning technical and biological variation, a foundation model learns to separate the clinically transferrable biology from the quirks of any one research study. We built Ladon to turn 25 years of discovery in cancer transcriptomics into real treatment decisions for patients.
Introducing Ladon
Ladon is a 3-billion-parameter transformer encoder-decoder trained on millions of bulk RNA-seq samples. It is pre-trained with masked token reconstruction on isoform-level sequences, and its design builds in inductive biases specific to transcriptomics and RNA biology. Because the objective is self-supervised, Ladon learns from every sample, not just the small fraction with outcome labels. The labeled data is then used to adapt Ladon to clinical tasks such as predicting survival, recurrence, and treatment response.
We intentionally evaluate every result in this paper in a setting not used to fit it: a held-out clinical trial, another cohort or another measurement platform. We first test Ladon on clinical outcomes, where it predicts survival and response in held-out trials better than differential gene expression and foundation model baselines. Its predictions also yield biomarkers of treatment benefit, which separate patients a drug helps from patients who simply have a better prognosis. We then deliberately challenge Ladon on two classic problems in transcriptomics: recovering isoform usage from gene-level data and inferring the cell composition of bulk samples from single-cell references. Finally, Ladon's performance improves as model size and compute grow, pointing to further gains from scale.
Clinical trial and biomarkers primer
Clinical trials test the safety and efficacy of new drugs, guiding which treatments reach patients and who should receive them. The practical question is whether a treatment improves outcomes enough to justify its risks, and which patients stand to benefit.
In oncology, trials measure whether tumors shrink, how long patients remain free of disease progression, and how long they survive. Tumor response can provide an earlier indication of activity, but does not by itself establish longer survival.
Biomarkers help connect differences in patients’ biology to their disease course and treatment outcomes. They range from a single protein measurement such as HER2 or PD-L1 to a score combining information from many genes, as as those we derive with Ladon. A prognostic biomarker provides information about a patient’s likely disease course in a given clinical setting. A predictive biomarker in contrast identifies patients who benefit more from one treatment relative to another.
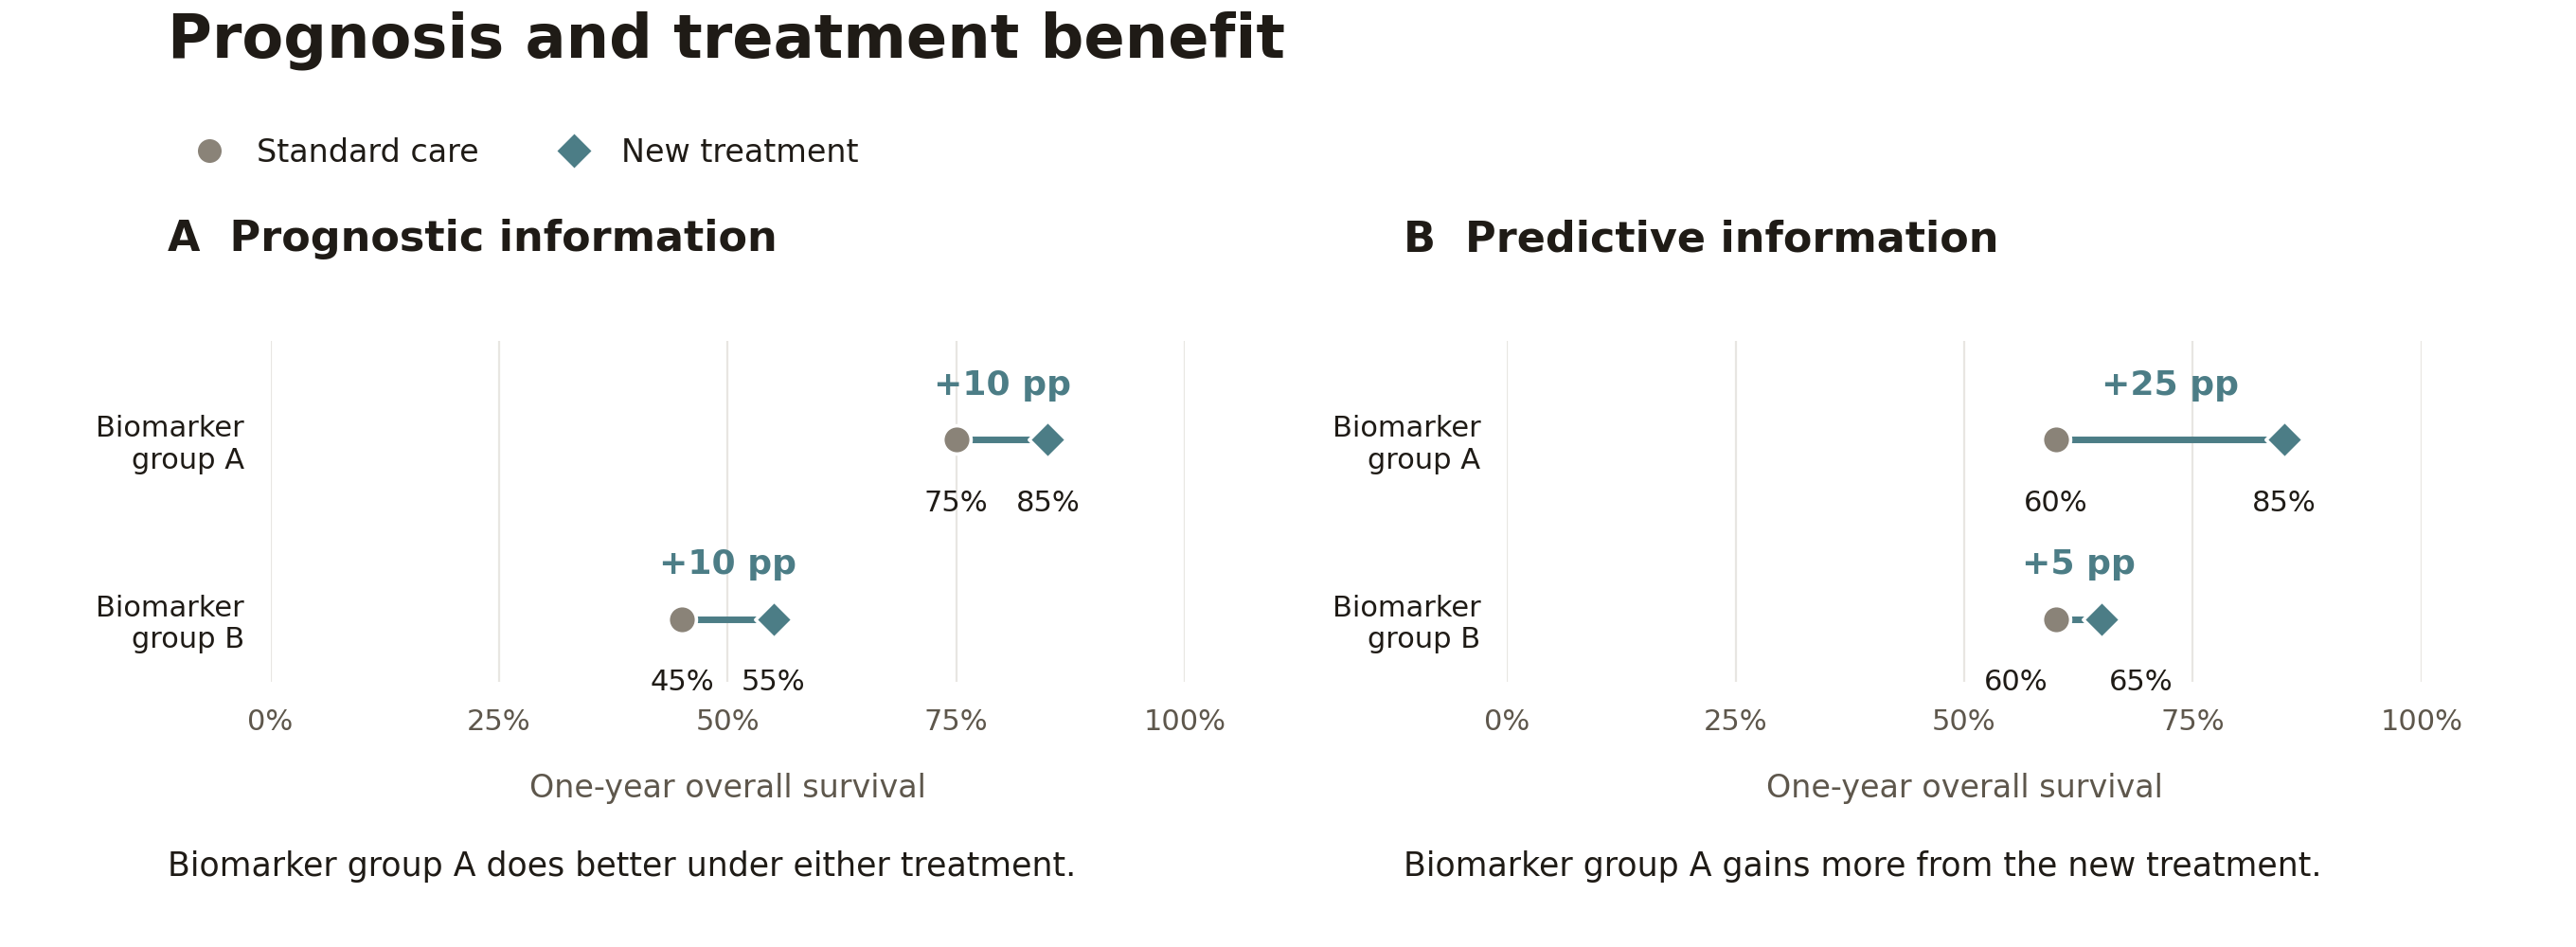
For treatment selection, we need to know whether a marker identifies greater benefit from one drug than another. A single treatment only group cannot resolve this on its own, because a prognostic biomarker separates outcomes there whether or not it predicts benefit (Fig. 1A). Randomized trials address this by having a control group and assigning treatment by chance, which balances the arms on average in every prognostic factor. A marker is then predictive if the difference in outcome between the arms changes with the marker (Fig. 1B). Without a randomized control arm, the comparison must instead rely on an estimate of how the same patients would have fared on the current standard of care.
A biomarker that predicts response does not necessarily identify the better treatment. For example, high PD-L1 was shown to have promising results in an early bladder cancer trial with a new immunotherapy treatment (Rosenberg et al., 2016). However, the subsequent randomized trial (Powles et al., 2018) found that patients with higher PD-L1 had nearly identical response rates to the control.
Reading the results
| Measure | What it tells us |
|---|---|
| C-index: survival ranking | How well the model ranks patients by survival time. A value of 0.6 means roughly 60% of eligible patient pairs are ordered correctly, and 0.5 represents chance-level ranking. Only pairs where we know which patient died first are counted. We use Uno’s C-index, which accounts for incomplete follow-up through censoring weights (Uno et al., 2011). |
| AUROC: response discrimination | How well the model ranks responders above non-responders. An AUROC of 0.7 means a randomly selected responder receives a higher score than a randomly selected non-responder about 70% of the time. It does not mean 70% of patients are classified correctly. Hanley & McNeil, 1982 |
| Hazard ratio: separation between groups | Compares event rates among patients who have not yet experienced the event. For higher-risk versus lower-risk groups, a hazard ratio of 2 means twice the instantaneous event rate under the proportional-hazards model—not twice the probability of dying by a particular time. NCI definition |
These measures describe outcome prediction and separation between patient groups. Establishing a predictive biomarker additionally requires testing whether treatment benefit differs with the marker.
Ladon predicts outcomes for unseen clinical trials
Clinical trials are generalization problems with billion-dollar consequences (DiMasi et al., 2016). The transition from Phase II to Phase III tests whether a treatment effect holds in a larger population treated at many more hospitals. These patients meet the same eligibility criteria but can still vary in biology and standard of care in ways the existing clinical parameters do not capture. A model that predicts patient outcomes faces the same challenges on every new trial: the new trial's patients and the sites and protocols that collected and processed their samples differ from those the model was fit on. We aimed to address precisely these generalization challenges by considering a held-out trial, as is done in a clinical setting.
We build up to this test by first showing that Ladon's predictions transfer between large independent cancer cohorts better than those of other RNA methods. We then find that Ladon separates survival better than these methods and clinical covariates in held-out clinical trials, and that its advantage grows as more labeled cohorts are pooled. Finally, we show that Ladon identifies patients who respond to immunotherapy better than PD-L1 expression does.
Ladon effectively generalizes across indications and end-points in a clinical context
The Cancer Genome Atlas (TCGA) and the Clinical Proteomic Tumor Analysis Consortium (CPTAC) are two large, independently assembled cancer cohorts that differ in patient populations, sample collection and processing (Cancer Genome Atlas Research Network, 2013; Li et al., 2023). We fit a linear Cox survival model on Ladon's fixed representations of one cohort and apply it unchanged to the other. Ladon predicts survival better than differential gene expression (DGE) signatures and two other RNA foundation models (BulkRNABERT and BulkFormer), both within and across cancers (Fig. 2). Within cancers, clinical covariates such as age, sex, and stage predict survival as well as Ladon or better, as expected in cohorts spanning early to advanced stages. Yet adding Ladon to these covariates improves survival prediction in all 12 target cohorts, showing that RNA contains information the clinical records lack.
Ladon yields prognostic biomarkers across unseen trials
We next apply the same procedure to eight held-out clinical trials, fitting each trial's survival model on TCGA and the other cohorts. Prediction within these trials is much harder: their eligibility criteria have already narrowed the most obvious prognostic factors, such as stage, performance status and treatment history. As expected, clinical covariates are significantly weaker predictors here. Ladon's risk score outperforms them and every other RNA method, with even its weakest trial matching baseline average (Fig. 3). In OAK, a phase III lung cancer trial, Ladon divided patients into two risk groups, with a nearly twofold difference in median survival: 7.9 versus 15.5 months (Fig. 4). These results demonstrate that Ladon enables transferring prognostic signal from existing cohorts to new clinical trials.
Ladon learns more efficiently from labeled outcomes than gene-level signatures
Ladon learns compact representations of RNA sequencing that allow outcome predictors to fit on its features to combine information across diverse labelled datasets. This means that existing public data should improve predictions on unseen cohorts, even when they come from other cancer indications. We therefore hypothesized that Ladon would gain more predictive power than other methods as cohorts are added, making better use of relatively scarce outcome labels. In Figure 5, performance grows as training expands from indication-matched source cohorts to all TCGA and then additional clinical cohorts. Given the same additional training data, Ladon’s accuracy keeps climbing while DGE begins to plateau (Fig. 5). These gains show that useful prognostic information can come from a broader set of survival datasets, reducing reliance on outcome labels collected specifically for the target indication.
Ladon predicts response to immunotherapy better than existing biomarkers
One of the challenges with using survival as an endpoint is how long it takes to measure, which makes tumor response a useful earlier readout (FDA, 2018). Response is often used to evaluate treatment activity in Phase II oncology trials. For immune checkpoint inhibitors, dozens of RNA signatures have been proposed to predict response, yet most fail in independent cohorts (Kang et al., 2023), and none has displaced PD-L1 in the clinic. We predict response in the immunotherapy arms of six held-out trials in lung, urothelial, kidney and liver cancer, counting complete or partial responses under RECIST as responders (Eisenhauer et al., 2009). A single classifier built on Ladon's representations learns from patients of many cancer types in published immunotherapy cohorts and the other trials. It then scores each held-out trial's patients from their pretreatment RNA. Ladon distinguishes responders from non-responders using pretreatment RNA sequencing, while the available clinical covariates, such as age stage or sex, perform no better than chance in these held-out immunotherapy cohorts (Fig. 6).
A prognostic score that holds in unseen trials has direct uses in drug development. FDA guidance recommends adjusting trial analyses for the most strongly prognostic covariates, including indices built from earlier studies, to measure a drug's effect more efficiently (FDA, 2023a). The gain grows with how much the score predicts beyond the clinical covariates, and in held-out trials Ladon adds to them substantially. Where a randomized control arm is impractical or unavailable, a trial can instead compare its patients with an external control cohort matched on prognosis (FDA, 2023b). Ladon's score could strengthen that match. Cancer trials take years and hundreds of patients because a drug's effect must be seen through large differences in prognosis. Patient transcriptomes collected in trials should be more than exploratory research data: they can make them smaller, faster and more informative by accounting for the prognostic differences.
Methods
Ladon representations. We perform supervised mid-training to predict patient and tumor characteristics, including disease stage, age, tumor grade and genomic alterations, alongside other clinical outcomes. We then discard the prediction heads and keep the encoder fixed, fitting downstream outcome predictors on the resulting embeddings.
Comparators. Each experiment uses a subset of these baselines:
| Comparator | Definition |
|---|---|
| DGE | Identifies genes associated with earlier events or longer survival and combines their expression into a risk signature. Signature size is selected through training-data cross-validation |
| Hallmark GSEA | Replaces individual-gene selection with enrichment across 50 established gene programs |
| BulkRNABert | Uses the published Hugging Face checkpoint and input processing (Gélard et al., 2025) |
| BulkFormer | Uses the 147M checkpoint (Kang et al., 2026) |
Clinical covariates. We encode baseline clinical covariates as text using BMRetriever-7B. They include age, sex and disease stage where available. Additional fields vary by cohort and include histology, grade, performance status and prior treatment.
Survival ranking. We measure survival ranking using Uno C-index (Uno et al., 2011) with inverse-probability-of-censoring weighting. We set the truncation time τ to the 70th percentile of observed death times. Censoring probabilities are estimated using reverse Kaplan–Meier on the full evaluation population. Comparisons are restricted to those whose earlier death occurs before τ; patients followed beyond this point remain eligible for comparison.
Statistics. We compare Ladon with each comparator using one-sided paired Wilcoxon signed-rank tests. P-values are unadjusted. Stars indicate p < 0.05, and exact values are available on hover.
Transfer between TCGA and CPTAC
TCGA and CPTAC outcome labels are excluded from Ladon’s encoder supervision and validation monitoring. We evaluate whether survival predictors transfer between TCGA and CPTAC across cancer indications represented in both datasets.
We evaluate Ladon’s embeddings after supervised mid-training. Here the model is trained to predict survival outcomes from other cohorts alongside patient characteristics such as disease stage, age and smoking status.
| TCGA | CPTAC | |
|---|---|---|
| Matched expression responsive evaluation subset | 2,461 patients across six cancers | 1,128 patients across six cancers |
| Cancers evaluated | Glioblastoma, head and neck, clear-cell kidney, lung adenocarcinoma, pancreatic and endometrial | Glioblastoma, clear-cell kidney, lung squamous, lung adenocarcinoma, pancreatic and endometrial |
| Transfer evaluated | CPTAC → TCGA | TCGA → CPTAC |
We standardize features using the source-data mean and standard deviation and fit ridge-regularized Cox models. These models share coefficients across source cohorts while allowing a separate baseline hazard for each cohort, using Breslow’s method for tied event times. Five-fold cross-validation, stratified by cohort and event status, selects the regularization strength by maximizing held-out partial likelihood. We then fit on all source samples and apply the predictor unchanged to the target dataset. For Ladon + clinical covariates, we concatenate Ladon and frozen BMRetriever-7B embeddings before fitting one Cox model.
Comparators include isoform TPM, clinical covariates, differential gene expression, Hallmark GSEA, BulkRNABert and BulkFormer. Embedding and isoform-feature baselines use the same source-fitted Cox procedure.
We evaluate survival ranking both within individual cancers and across cancers. Within each transfer, we average the six cancer-specific C-indices equally. For pan-cancer evaluation, we calculate one C-index across all selected target patients, including comparisons between cancers. We then average the two transfer scores equally.
Wilcoxon tests pair cancers within each transfer and transfer-level scores for the pan-cancer summary.
Survival in held-out trials
We evaluate whether Ladon’s predicted risk separates patients with different overall survival (OS) and progression-free survival (PFS). We use embeddings from the survival-supervised Ladon model. Evaluation includes six OS readouts and three PFS readouts across eight clinical trials.
| Evaluated trial | Cancer indication | Endpoint evaluated |
|---|---|---|
| OAK | Non-small-cell lung cancer | OS |
| POPLAR | Non-small-cell lung cancer | OS |
| IMpower133 | Small-cell lung cancer | OS |
| IMvigor010 | Urothelial carcinoma | OS |
| IMvigor210 | Urothelial carcinoma | OS |
| IMbrave150 | Hepatocellular carcinoma | OS and PFS |
| IMmotion150 | Renal cell carcinoma | PFS |
| IMmotion151 | Renal cell carcinoma | PFS |
We fit separate outcome predictors for overall survival and progression using TCGA and other clinical trials. Features are standardized using the training-data mean and standard deviation. We fit ridge-regularized Cox models with shared coefficients and separate baseline hazards for each TCGA project and trial-arm group, using Breslow’s method for tied event times. Ladon and the standalone embedding baselines use a fixed regularization strength of λ = 0.3, selected once on TCGA.
Comparators include differential gene expression, isoform TPM and other foundation models: BulkRNABert, BulkFormer and BMRetriever-7B.
The isoform-TPM baseline uses 100 principal components and an elastic-net Cox model fitted on cancer-matched source cohorts. Regularization is selected through source-cohort cross-validation. Most trials use matched TCGA cohorts; IMpower133 uses CPTAC lung cohorts.
We fit a separate Cox predictor on the clinical-covariate embeddings. For Ladon + clinical covariates, we standardize the molecular and clinical risk scores within each evaluated trial and endpoint. We then sum them with equal weights. The clinical component in this combination uses a cross-validated regularization strength; the standalone clinical-covariate baseline uses the fixed penalty described above.
Within each trial and endpoint, we split patients at each method’s median predicted risk. Patients above the median form the higher-risk group; patients at or below it form the lower-risk group. We estimate the hazard ratio between these groups using an unpenalized Cox model with a binary risk-group indicator. The model is stratified by treatment arm and handles tied event times with Efron’s method. These hazard ratios use the full available follow-up.
We summarize OS and PFS separately using equal-trial geometric means. IMbrave150 has no patient-specific clinical covariates. Its clinical-only hazard ratio is not estimable. The clinical-only summaries therefore include five OS trials and two PFS trials; the combined predictor uses Ladon alone for IMbrave150.
Wilcoxon tests on log hazard ratios pair the same trials separately for OS and PFS. Comparisons include only trials with estimable results for both methods.
Additional labeled cohorts
We hold the trained encoder fixed and fit a Cox model on top of the featurized RNA sequencing samples. We compare three training pools: cancer-matched source cohorts, all eligible TCGA cohorts, and TCGA combined with non-trial cohorts and the other clinical trials. The paired cohorts were selected to most closely resemble the trial population.
| Source cohort used for fitting | Evaluated trial | Trial indication |
|---|---|---|
| TCGA lung adenocarcinoma + lung squamous cell carcinoma (LUAD + LUSC) | OAK | Non-small-cell lung cancer |
| TCGA LUAD + LUSC | POPLAR | Non-small-cell lung cancer |
| CPTAC lung adenocarcinoma + lung squamous cell carcinoma | IMpower133 | Small-cell lung cancer |
| TCGA bladder urothelial carcinoma (BLCA) | IMvigor010 | Urothelial carcinoma |
| TCGA BLCA | IMvigor210 | Urothelial carcinoma |
| TCGA liver hepatocellular carcinoma (LIHC) | IMbrave150 | Hepatocellular carcinoma |
We fit regularized Cox models on Ladon embeddings. The cancer-matched models use elastic-net regularization selected through source-cohort cross-validation. The pooled models use ridge regularization with the penalty selected once on TCGA and held fixed across subsequent fits (λ = 0.3). These models share coefficients across cohorts while allowing separate baseline hazards for each source cohort and trial arm. The first transition therefore changes both the training data and the fitting procedure.
| Stage | Training data | Outcome-predictor fitting |
| Matched source | Cancer-matched cohorts; 297–958 samples. IMpower133 uses CPTAC lung. | Unstratified elastic-net Cox, with equal L1/L2 weighting. Three-fold cross-validation selects the regularization strength using Harrell C. |
| All TCGA | 7,569 samples across 20 eligible TCGA projects. | Ridge Cox with a separate baseline hazard for each TCGA project and shared embedding coefficients. |
| + trials | TCGA, non-trial cohorts and other clinical trials; 17,378–17,929 samples. The evaluated trial is excluded. | Same ridge procedure, with separate baseline hazards for each TCGA project, additional cohort and trial–arm group. |
For comparison, DGE and Hallmark GSEA signatures are fitted within the same training pools.
We evaluate survival ranking separately in six clinical trials using Uno C-index. We report the mean trial Uno C-index, weighted by the number of evaluated patients in each trial.
Immunotherapy response
We evaluate Ladon’s ability to predict tumor response from pretreatment RNA sequencing across six clinical trials. We use Ladon after supervised mid-training that includes response labels from academic cohorts.
| Evaluated trial | Cancer indication |
|---|---|
| OAK | Non-small-cell lung cancer |
| POPLAR | Non-small-cell lung cancer |
| IMvigor210 | Urothelial carcinoma |
| IMmotion150 | Renal cell carcinoma |
| IMmotion151 | Renal cell carcinoma |
| IMbrave150 | Hepatocellular carcinoma |
Evaluation includes immunotherapy-treated patients with a designated pretreatment RNA sample and an evaluable response outcome. Complete or partial responses under RECIST (Eisenhauer et al., 2009) are classified as responders; other evaluable responses are classified as non-responders.
We use TabICL v2 (Qu et al., 2026), a pretrained tabular classifier that uses labeled patient examples as context to predict response probabilities. The context contains 1,419 patients from 33 academic cohorts, together with patients from the other trials in the response benchmark. The evaluated trial is always excluded from this context.
We reduce mean-pooled Ladon embeddings to 128 principal components, fitting PCA only on the context patients. Features are centered without variance scaling. We then combine these components with cancer-indication and treatment indicators and apply TabICL to the evaluated trial.
Comparators include differential gene expression, gene TPM, PD-L1 mRNA and other foundation models: BulkRNABert, BulkFormer and BMRetriever-7B. Their embeddings use the same PCA and TabICL procedure as Ladon.
The gene-expression baseline uses log₂(TPM + 1) for 20,250 protein-coding genes, followed by PCA and TabICL. This baseline uses academic cohorts alone as context. DGE identifies genes associated with response while accounting for cohort differences, then combines their standardized expression into a response signature. Signature size is selected through five-fold cross-validation within the context data. PD-L1 mRNA uses CD274 expression directly and requires no fitting.
We apply the same TabICL procedure to the clinical-covariate embeddings. IMbrave150 has no patient-specific clinical fields. This baseline therefore produces constant scores in that trial.
We measure response discrimination using AUROC separately within each trial. We then average the six trial-specific AUROCs equally.
Wilcoxon tests pair AUROCs from the same six trials.
Ladon predicts treatment benefit better than existing biomarkers
Predictive biomarkers can guide clinical development by identifying patients most likely to benefit from a treatment and providing clues to its mechanism of action. However, candidate biomarkers are often identified through their association with outcomes in patients who received a drug. An association may reflect prognosis, or baseline risk, rather than greater benefit from that drug compared with standard of care.
In this section, we show that many of the signals in gene and pathway markers are explained by broader molecular prognosis built on Ladon embeddings. We then learn a Ladon-derived score for treatment benefit from randomized trials. In a held-out trial, the Ladon score identifies patients who would benefit from treatment better than existing biomarker baselines.
We first examined how gene and pathway associations with progression-free survival (PFS) change after accounting for a broader molecular prognosis score. We inspected variable genes and Hallmark pathway scores in the immunotherapy-containing arms of two lung cancer trials, OAK and POPLAR, and two kidney cancer trials IMmotion150 and IMmotion151.
For each marker, we compared association with PFS before and after adding a Ladon risk score. This tests whether the marker still provides information about trial PFS among patients with similar Ladon-predicted prognosis.
Many marker–PFS associations lose statistical support after accounting for Ladon prognosis (Fig. 7). Of 304 associations significant before adjustment, 24 remained significant. As an example, previous work linked plasma-cell signatures to survival following atezolizumab treatment (Patil et al., 2022). In our experiment, IGHG2, a component of this expression program, was associated with longer PFS in the atezolizumab arms of both lung trials. After adjustment for Ladon prognosis, this association was no longer significant in either trial (q-value 0.015 to 0.420 and 0.018 to 0.177, respectively).
Since existing biomarkers are insufficient to establishing treatment benefit, we next explore whether a Ladon-derived marker distinguishes the benefit of treatment from control.
Ladon identifies predictive biomarkers on held-out data
We investigate whether Ladon can directly identify predictive biomarkers. We combine the principled nature of R-learning (Nie & Wager, 2021) with the expressivity of a large neural network to directly optimize for a biomarker that shows a large gap in the treatment arm and minimal difference in the control arm. While this optimization problem was previously feasible, a good solution requires a sufficiently expressive and powerful feature extractor.
To address treatment benefit, we trained a model head to estimate how the difference in 12-month PFS between treatment and control varies with a tumor's molecular features. As in the previous section, we first use a Ladon-derived score to regress out prognostic signal in both arms. A benefit head then learns how the remaining differences in 12-month PFS between treatment and control varies with a tumor's molecular features. We fit this model on five trials and applied it to POPLAR, a randomized trial in which atezolizumab was compared with docetaxel (Fehrenbacher et al., 2016). The resulting score stratifies high- and low-risk groups in the treatment arm while not separating patients in the control arm. Computing the final score on a new sample only requires the tumor's RNA profile processed by Ladon.
We compared the Ladon-derived score with RNA reconstructions of the published AP/T (Iwai et al., 2021), plasma-cell (Patil et al., 2022), TLS3 (Du et al., 2025), and PD-L1 (Fehrenbacher et al., 2016) mRNA. These are standard signatures used for recommending treatment. Ladon produced greater observed treatment-benefit separation than these comparators (Fig. 8). On atezolizumab, 28% of patients with high Ladon scores were progression-free at 12 months, against 6% of patients with low scores. On docetaxel, the two groups fared alike (14% and 13%).
The PFS score also stratifies tumor response
We then evaluated the same PFS scores and groups against another clinically relevant endpoint: recorded tumor response. Without any additional training, patients with higher Ladon PFS scores had more response to atezolizumab (Fig. 9).
These results show that Ladon makes treatment benefit predictions that generalize to unseen data better than previously discovered biomarkers. With this ability to design scores that can isolate prognostic and predictive effects, we enable clinical development scientists to identify patient populations who are especially likely to benefit from a specific treatment option.
Methods
Association models and endpoints
We assessed whether individual gene and pathway markers retained an association with progression-free survival (PFS) after accounting for Ladon-derived prognosis. We analyzed the RNA-profiled subsets of IMmotion150 (\(n=177\)), IMmotion151 (\(n=823\)), OAK (\(n=699\)), and POPLAR (\(n=192\)), fitting models separately within each trial and treatment arm.
We used the recorded PFS times and event indicators to analyze progression or death over the full available follow-up. Patients without an observed event contributed follow-up until their recorded censoring time. This analysis uses the full survival endpoint; the treatment-benefit analysis below targets PFS at 12 months.
For each marker, we fitted two Cox proportional-hazards models to the same patients (Cox, 1972):
Here, \(M\) denotes standardized gene expression or a pathway score, and \(R\) denotes the fixed Ladon prognostic risk score. We standardized markers using OAK as the reference for lung cancer and IMmotion151 for renal cancer. Each model includes one candidate marker. The coefficient \(\beta\) describes its association with PFS alone; \(\beta_{\mathrm{adj}}\) describes its association conditional on Ladon prognosis.
We estimated the regression coefficients by maximizing the unpenalized Cox partial likelihood, using Efron's approximation for tied event times. Each event contributes a comparison with patients still under observation and event-free at that time. In the adjusted model, we estimated both \(\beta_{\mathrm{adj}}\) and \(\gamma\) within the trial arm while keeping the upstream Ladon risk predictor fixed.
We obtained \(R\) from a survival probe trained on progression-free interval (PFI) in TCGA (Cancer Genome Atlas Research Network, 2013), using a frozen Ladon representation. We used this score as a molecular prognosis covariate for trial PFS. We report marker construction, hazard ratios, and statistical tests below.
Marker construction, tests, and display selection
We screened 550 candidate markers: 500 variable genes and 50 Hallmark pathways. We summed transcript-level transcripts per million (TPM) to obtain gene-level abundance and transformed each value as \(\log_2(1+\mathrm{TPM})\). Among genes measured in all four cohorts, we selected the 500 with the highest average expression variance across OAK and IMmotion151. This selection used expression values only. We calculated Hallmark pathway scores using single-sample gene set enrichment analysis (ssGSEA), with rank-weighting exponent \(0.25\), and standardized all markers using the reference cohorts defined above.
For each marker, we report the estimated hazard ratio and its pointwise 95% Wald confidence interval:
The hazard ratio describes the association with a one-reference-standard-deviation increase in the marker. Values below \(1\) indicate a lower progression-or-death hazard; values above \(1\) indicate a higher hazard. For the adjusted model, we replace \(\widehat{\beta}\) with \(\widehat{\beta}_{\mathrm{adj}}\).
We tested the null hypothesis \(H_0:\beta=0\) using a two-sided Wald test:
where \(\Phi\) is the standard normal cumulative distribution function. In the adjusted model, we tested \(H_0:\beta_{\mathrm{adj}}=0\).
We applied the Benjamini–Hochberg procedure separately to all 550 marker p-values within each trial, treatment arm, and adjustment condition (Benjamini & Hochberg, 1995). We denote the resulting adjusted p-values by \(q\) and identify significant associations at \(q<0.05\). This procedure accounts for the number of markers tested and targets a 5% false discovery rate: the expected proportion of false discoveries among the associations declared significant.
We plot \(-\log_{10}(q)\) in Figure 7 so that stronger statistical evidence appears higher on the axis. The significance threshold corresponds to \(-\log_{10}(0.05)\approx1.30\). We display markers that met \(q<0.05\) in the marker-only model and follow those same markers after adjustment. We retain the complete 550-marker family for both multiple-testing corrections.
Benefit learning and target evaluation
The final head uses all embedding dimensions, standardized using training patients. Sources are IMmotion150, IMmotion151, IMbrave150, OAK, and IMpower133. The encoder is not fine-tuned.
Within each source trial, five-fold cross-fitting estimates expected 12-month PFS using censoring-weighted logistic regression (C=1), clinical covariates. Ridge penalties span 10⁻⁴ through 10³ and are selected by mean leave-one-source-trial-out R-loss, with fold-specific feature standardization and ties favoring stronger regularization.
Comparator definitions follow the frozen AP/T reconstruction (Iwai et al., 2021), plasma-cell reconstruction (Patil et al., 2022), and TLS3 reconstruction (Du et al., 2025). They contain four, fourteen, and nineteen genes, respectively. CD274 uses gene-level log-transformed TPM.
The transfer of Ladon's predictions across cohorts and trials shows that it learns signals robust to the technical differences between them. We next deliberately challenged our model on two classic problems in transcriptomics to test how far the generalization capability extends. The first asks Ladon to recover isoform dynamics from inherently gene-level inputs that do not measure isoforms directly. The second asks it to learn cellular composition from single-cell transcriptomics and infer it in bulk samples, where composition is not measured directly.
Ladon understands isoform dynamics across biological contexts
Most human genes are expressed as several isoforms through alternative splicing. These transcripts of the same gene have different exons and often encode proteins with different functions. The ratio among a gene's relative isoform abundances can matter as much as its absolute expression level. For example, the insulin receptor (INSR) has two primary isoforms that differ by one exon. The form that skips it (IR-A) binds IGF-II with high affinity (Frasca et al., 1999), whereas the form that includes it (IR-B) predominates in several insulin-responsive tissues (Moller et al., 1989).
The balance between IR-A and IR-B varies across biological contexts. IR-A is a minor isoform in liver and skeletal muscle but accounts for more than 40% of INSR transcripts on average in stomach tumors (Fig. 10). Its percentage also varies among patients with the same cancer. Gene-level expression reflects the context, such as the levels of the splicing factors that regulate isoform choice. We therefore asked whether Ladon learns the context to recover the variation from gene-level expression alone. We tested this by withholding individual transcript abundances and asking Ladon to predict each isoform’s percentage of the gene’s RNA.
In 166 stomach tumors from TCGA (Cancer Genome Atlas Research Network, 2013), Ladon accurately predicted INSR isoform usage from gene-level expression with a Pearson correlation of 0.93 (Fig. 11).
To test whether this result extended beyond INSR, we evaluated 3,000 randomly sampled multi-isoform genes in eight held-out cancer types. We compared Ladon with the cohort-trained baseline, a ridge regression model fitted to each cohort’s own isoform measurements, and with two predictors trained on public data, a ridge regression model and an average over each tumor’s nearest public samples. Ladon tracked tumor-to-tumor variation in isoform percentage more accurately than all three (median Pearson r of 0.81, compared with 0.69, 0.54 and 0.48, respectively). We further examined five genes with well-characterized alternative isoforms: CD44, INSR, KRAS, MKNK2 and TPM1. For example, KRAS4A and KRAS4B are both expressed in tumors but use different membrane-targeting mechanisms (Tsai et al., 2015). Ladon exceeded the baseline in all 21 gene–cancer-type combinations (Fig. 12b).
Ladon imputes isoform dynamics from gene level sequencing
Most single-cell RNA-seq methods sequence only one end of each transcript and resolve isoforms poorly (Zheng et al., 2017). Recovering isoform information from these data therefore requires inference. This inference is also a hard test of generalization because single-cell and single-nucleus profiles differ systematically from bulk RNA-seq in platform-specific technical variation (Newman et al., 2019). We tested Ladon in two datasets with matched bulk RNA-seq as the reference. In each, we summed a sample's cells into a gene-level pseudobulk profile and scored the predicted change in isoform percentage between samples against the change measured in the matched bulk sample (Fig. 13).
In ENCODE4 (Kagda et al., 2025), one of the largest switches between two organs of the same donor was in TBC1D4. TBC1D4-201 accounted for 74% of the gene’s RNA in one donor’s adrenal gland and approximately 0% in the same donor’s skeletal muscle, and Ladon predicted 71% and 2%. More broadly across 1,402 within-donor tissue comparisons, Ladon predicted the changes in isoform percentage more accurately (Pearson correlation 0.80) than the organ-average lookup (0.68) or expression-based baselines (0.66–0.67).
Finally, we analyzed 35 blood draws from 17 people in a longitudinal COVID-19 study (Giroux et al., 2022). Here the changes are within a single tissue, either longitudinally over 14 days or between COVID-19 patients and healthy controls. Such changes are typically subtler than switches between tissues and harder to predict. We compared Ladon with isoform quantification from the pooled single-cell reads themselves, scoring whether each method predicted the direction of change correctly (Fig. 14). Among the 5% of genes with the largest measured changes (460 genes), Ladon was correct for 66% of genes over time and 70% between COVID-19 and healthy controls, compared with 58% and 59% for direct quantification (McNemar P = 0.003 and P < 0.001, respectively). As expected, accuracy declined as the measured changes became smaller. Ladon nevertheless stayed ahead at every cutoff down to all 9,207 expressed multi-isoform genes (56% compared with 53%).
Together, these results show that Ladon can infer isoform usage from gene-level expression, suggesting that it captures relationships between biological context and isoform choice. This capability could help discover disease-associated isoform changes.
The natural next steps are broader application and a stronger reference. The single-cell and single-nucleus analyses presented here pooled all cells of a sample. Ladon remains to be tested on cell-type pseudobulks and individual cells. Ladon was also trained and evaluated on short-read isoform estimates, and its accuracy is bounded by theirs. Long-read sequencing addresses both by reading full-length transcripts directly and resolving isoforms that short reads can only infer. Expanding them for training and evaluation is a key direction for future versions of Ladon.
Methods
Model input. Ladon received gene-level expression only. Pretraining excluded the TCGA cohorts and included the ENCODE4 and blood bulk reference libraries.
Public-reference baselines. Three baselines draw on the full public reference. The public ridge baseline uses 100 principal components of standardized log-transformed expression of the 5,000 most variable genes. It is fitted on every reference sample, with the penalty chosen on held-out reference samples. The nearest-sample baseline averages the isoform percentages of the nearest reference samples by cosine distance in that space. We used 20 nearest samples in the 3,000-gene analysis and 50 in the organ comparison. The organ-average lookup returns the mean isoform percentages of reference samples labeled with the target organ.
Confidence intervals. 95% confidence intervals are percentile bootstrap intervals with predictions held fixed. The INSR analysis resamples tumors 2,000 times. The 3,000-gene analysis draws 1,000 paired resamples of tumors and eligible genes within each cancer type. The organ comparison resamples genes 500 times, each with all its comparisons.
Tumor cohorts
Gene-level expression is the sum of kallisto transcript TPM within each gene. Isoform percentages are normalized within each gene over the quantified GENCODE 41 transcripts in the model vocabulary. The INSR analysis includes the 166 stomach tumors with INSR expression of at least 10 TPM. In the other tumor analyses, a gene is eligible in a cancer type if it has at least two modeled isoforms and at least 10 TPM in at least 80% of tumors. The 3,000-gene analysis samples genes without replacement from the 8,807 eligible in at least one of eight cancer types. The five-gene analysis scores five well-known isoform genes in the five cancer types where at least four of them are eligible.
In the 3,000-gene and five-gene analyses, each isoform's predicted and measured percentages are centered on their means across the tumors of a cancer type. Centering makes the score reflect tumor-to-tumor variation rather than each isoform's average level. One Pearson correlation is then computed over all centered tumor–isoform values of a gene in a cancer type, and the 3,000-gene analysis reports the median across gene–cancer-type pairs. Isoform-percentage error is half the summed absolute difference between predicted and measured percentages over a gene's isoforms. It equals the share of the gene's RNA that would have to move between isoforms to match the measurement. The error is averaged over each tumor's scored genes and reported as the median over the 1,572 tumors.
The cohort-trained baseline is a ridge regression of isoform percentages on principal components of log-transformed gene expression. A second step regresses the remaining error on the gene's own expression level, which lets the baseline use that level directly. The baseline is evaluated by fivefold cross-validation within each cancer type, with scaling and components fitted on training samples only. Inner threefold cross-validation chooses the number of components (5 to 100) and the ridge penalty (0.03 to 3) for each isoform. Negative predictions are clipped to zero and percentages renormalized within each gene.
ENCODE4 organs
STARsolo GeneFull counts are summed over the nuclei of each tissue piece, divided by genomic gene length and scaled per million. To correct nuclear–bulk differences, we add a per-gene offset on the log₂(1 + expression) scale. The offset is the mean bulk–nuclear difference across the other tissues, excluding the scored donor's bulk. One offset per gene holds across expression levels on the log scale because the differences are multiplicative. Corrected values are transformed back to the per-million scale Ladon takes as input, then clipped at zero and renormalized.
Contrasts are selected in the Genotype-Tissue Expression project (GTEx; GTEx Consortium, 2020), where each tissue's 40 reference samples are split into a discovery group and a replication group of 20. In the discovery group, a gene must reach 10 TPM in at least 80% of samples of both tissues. Its isoforms are ranked by mean percentage across the two tissues, and the top two must together account for at least 80% of each tissue's mean percentage. The top isoform's mean percentage must differ between tissues by at least 25 percentage points in the discovery group and by at least 15 in the same direction in the replication group. The replication group guards against selecting noise. Its bar is lower because a difference selected in one sample set shrinks on re-measurement. This yields 837 gene–tissue-pair contrasts across 287 genes. They are scored in every ENCODE4 donor with both tissues, giving 1,402 comparisons across seven donors.
Percentages are averaged over pieces of the same tissue from the same donor before taking tissue differences. The score is the Pearson correlation between predicted and bulk-reference changes across all comparisons. All expression-based methods receive the same corrected counts; the organ-average lookup receives the organ label.
Blood
Single-cell reads are pooled by draw and quantified with kallisto. Ladon receives each draw's summed gene counts scaled per million, without length or per-gene correction. The isoform estimates from the same kallisto run are the comparator.
For gene filtering, bulk TPM is rescaled to sum to one million over the nuclear-encoded protein-coding transcripts in the model vocabulary. We keep the 9,207 genes with at least two modeled isoforms and at least 10 on this scale in at least 80% of draws. A gene's main isoform has the largest mean bulk-reference percentage over all 35 draws. We score two contrasts: the mean within-person change from day 0 to day 14 in nine people, and the difference in mean percentage between 26 COVID-19 draws and four healthy draws.
A prediction is correct when its change has the same sign as the bulk-reference change. Within each contrast, genes are ranked by absolute bulk-reference change, and the direction test uses the top 5% (460 genes). Exact two-sided McNemar tests compare the methods' correct and incorrect calls on these matched genes (P = 0.003 for day 0 to day 14; P < 0.001 for COVID-19 versus healthy draws).
Ladon distinguishes cell composition signal from cross-platform batch effects
In bulk tissue transcriptomes, cellular composition is the major source of variation (Farahbod & Pavlidis, 2020). Different cell types are defined by distinct gene expression programs, and a change to the relative fraction of a cell type proportionally shifts every gene that cell type expresses. In diseases like cancer, the composition is itself a clinical biomarker that directly reflects the disease state (Pagès et al., 2018). The tumor comprises heterogeneous subpopulations of malignant cells as well as non-malignant cells that make up the tumor microenvironment, which impacts prognosis and response to therapy. For example, infiltrating T cells predict response to immunotherapy (Tumeh et al., 2014), stromal cells can secrete growth factors that confer drug resistance (Straussman et al., 2012), and abnormal blood vessels limit drug delivery (Jain, 2005).
While bulk RNA-seq can only measure a coarse average expression over all cells in a sample, it does so linearly over tens of thousands of genes (Fig. 15). In principle, the composition can thus be recovered by linearly solving for the proportions given a reference profile for each cell type (Abbas et al., 2009). Known as deconvolution, this approach has long been popular in clinical transcriptomics and now often uses single-cell references (Newman et al., 2019). In practice, compositions learned from single-cell data transfer poorly to real bulk samples (Huuki-Myers et al., 2025). Technical differences between single-cell and bulk RNA-seq dwarf the biological differences between samples. As a result, cancer single-cell transcriptomes have not yet led to better compositional subtyping of individual clinical samples. Closing this gap would be a prototypical test of a model's ability to generalize across technology platforms, whose differences plague clinical transcriptomics.
Ladon deconvolves bulk RNA-seq by generalizing from single-cell references
To this end, we jointly post-trained Ladon on real bulk RNA-seq and on synthetic bulks summed from single-cell RNA-seq (Youngblut et al., 2026) to project both into a shared representation (Fig. 16). A deconvolution model trained to predict cell-type proportions from the representations of synthetic bulks of a single-cell reference then infers the composition of real bulk samples. Although its deconvolution model learns only from single-cell references, Ladon deconvolves real PBMC bulk samples (Giroux et al., 2022) more accurately than established methods using the same references (Newman et al., 2015; Tsoucas et al., 2019; Chu et al., 2022) and than methods whose references were built from bulk RNA-seq of sorted cells (Racle et al., 2017; Monaco et al., 2019; Fig. 17).
We next used the same approach to estimate the molecular subtype composition of pretreatment breast cancer bulk transcriptomes and to test whether it predicts response to neoadjuvant therapy, given before surgery. The single-cell reference was a primary breast tumor atlas (Xu et al., 2024) with 12 classes: malignant cells of four molecular subtypes (Wu et al., 2021) and eight immune, stromal and normal epithelial cell types. We then fit logistic regression models of pathological complete response (pCR, no invasive cancer remains in the breast or lymph nodes at surgery) on the inferred class shares in a single cohort, TransNEO (Sammut et al., 2022), separately for ER+/HER2− and HER2+ tumors. We applied these models unchanged to four external cohorts (Earl et al., 2015; Sammut et al., 2022; Pernas et al., 2022; Fig. 18). In the two ER+/HER2− cohorts, the model predicts pCR better (AUC 0.90 and 0.97) than expression-based surrogates (Gendoo et al., 2016) of the classic, commercially deployed Oncotype DX (Paik et al., 2004; 0.75 and 0.77) and MammaPrint (van 't Veer et al., 2002; 0.88 and 0.87) assays. In the two HER2+ cohorts, it exceeds HER2 expression (0.82 and 0.74, against 0.71 and 0.53).
Altogether, these results demonstrate how a transcriptomic foundation model enables knowledge from single-cell data to facilitate inference on bulk samples. Because Ladon's post-training covers single-cell data from many tissues, two directions follow. First, plug-and-play deconvolution of most clinical bulk transcriptomes should be feasible without user-specified references. Second and more broadly, the post-trained representation itself could serve a compositional feature space to downstream clinical prediction models. Such a feature space describes each tumor not as a single subtype but along a continuum of mixed malignant and non-malignant cell types (Fig. 19). Complex intratumoral heterogeneity is a persistent challenge for cancer therapy (McGranahan & Swanton, 2017), and we should make it measurable through routine clinical sampling of transcriptomes.
Methods
Synthetic bulks
A pseudobulk is the per-gene sum of the counts of a group of cells from one single-cell sample. Summed over all of a sample's cells, a pseudobulk resembles a bulk RNA-seq sample of the same tissue. We used single-cell samples as additional bulk samples in this form. To increase their diversity, we drew synthetic bulks: mixtures of one sample's cluster pseudobulks in new proportions. Mixing within one sample keeps the donor, cell states and batch of a real sample. Each draw perturbed the observed composition on the log scale: we multiplied every cluster's share by the exponential of a Gaussian draw and renormalized. The draw was intended to give correlated factors to clusters with similar expression profiles. The scale of the draw set the size of the change, which ranged from compositions close to the observed one to markedly different ones. We subsampled the cluster pseudobulks to the new proportions at depths typical of bulk RNA-seq and summed them into the synthetic bulk.
Pseudobulks for post-training
We built the post-training pseudobulks from the human and mouse 10x single-cell RNA-seq experiments of scBaseCount (Youngblut et al., 2026). We requantified each experiment from its sequencing reads and clustered its cells. Every cluster became a pseudobulk. For each pseudobulk, we recorded its number of cells per scBaseCount predicted cell type. The resulting store holds about 45,000 experiments with about 1.5 million pseudobulks.
Ladon post-training
We post-trained a pretrained Ladon model on two kinds of samples. Bulk transcriptomes from the pretraining corpus kept the pretraining objective. Synthetic bulks drawn from the post-training pseudobulks had the pretraining objective and a composition objective. The composition objective trained the representation so that a linear readout recovers the cell-type composition of synthetic bulks. A random subset of single-cell studies contributed no synthetic bulks. These held-out studies included the single-cell study paired with the PBMC test bulks. A sample's representation is the mean of the encoder's latent outputs.
Deconvolution model
For each single-cell reference, we trained a deconvolution model in three steps.
- We drew synthetic bulks from the reference (Synthetic bulks, above), with its annotated cell types as the groups of cells. We computed their representations.
- We standardized the representations and reduced them to 64 principal components.
- We trained one TabICL regressor (Qu et al., 2026) per cell type to predict that type's share from the components.
To deconvolve a real bulk, we standardized its representation and projected it onto the principal components, both as fitted on the reference's synthetic bulks. We predicted each cell type's share, clipped the shares at zero and rescaled them to sum to 1.
Confidence intervals
We computed 95% intervals as percentiles of 2,000 bootstrap resamples. For deconvolution accuracy, we resampled donors, each with all of its test bulks, and used the same resamples for every method. For response prediction, we resampled each cohort's patients and discarded resamples with a single class.
PBMC deconvolution benchmark
Test bulks. We used 35 PBMC bulk RNA-seq samples from 17 donors (GEO GSE206263). Each has single-cell RNA-seq of the same blood draw (GSE206283; SuperSeries GSE206284; Giroux et al., 2022). For composition labels, we took each cell type's share of the annotated cells' UMIs in the paired single-cell data.
Reference. We used four other PBMC studies in scBaseCount (SRA SRP359840, SRP411630, SRP345080 and SRP559768; 165 samples; two with 3′ and two with 5′ libraries). We grouped cells into five lineages: CD4 T, CD8 T, NK, B/plasma and monocyte (including macrophages). We drew 500 synthetic bulks per study (2,000 in total) from samples with at least 20 cells of every lineage. We discarded draws in which the five lineages held less than half of the counts. We trained one deconvolution model on the 2,000 synthetic bulks.
Prior methods. Comparators used the same references or published bulk-derived ones. We mapped their cell types to the five lineages.
- We reimplemented CIBERSORT and DWLS from their published algorithms. Both used a signature of the references' mean lineage gene CPM over 1,000 marker genes (200 per lineage). For CIBERSORT, we fit \(\nu\)-support vector regression on z-scored gene TPM. We kept the lowest-error fit and set negative weights to zero. For DWLS, we ran reweighted least squares on gene CPM from a non-negative least-squares start. The weights were \(1/\hat{y}^2\).
- We ran BayesPrism on bulk counts with single cells of the four references (scBaseCount UMI counts; up to 50 cells per sample and lineage, about 8,000 per lineage), with each cell's lineage as its cell type and cell state.
- EPIC and ABIS use references from bulk RNA-seq of sorted cells. We ran EPIC with its BRef reference on TPM. EPIC returns mRNA proportions. ABIS is robust linear regression on its RNA-seq signature.
Accuracy. We computed two measures per lineage across the 35 test bulks. The first was the Pearson correlation between inferred and measured shares. The second was the pairwise ordering accuracy. For every pair of test bulks whose measured shares of a lineage differ, we checked whether the inferred shares put the two bulks in the same order. Each pair was counted once. The accuracy is the fraction of pairs in the right order, with tied inferred shares counted as half right. We averaged both measures over the five lineages.
Breast cancer response prediction
Reference. We used the treatment-naive primary tumors of four datasets of the Xu et al. (2024) atlas (65 tumors, 179,852 cells). We mapped atlas labels to 12 classes. We split cancer epithelial cells into Her2, LumA, LumB and Basal by the atlas's SC50 calls. The other eight classes are T and NK cells, B cells, plasmablasts, myeloid cells, cancer-associated fibroblasts, perivascular-like cells, endothelial cells and normal epithelial cells. In each tumor, we summed the cells of every class with at least 20 cells into a class pseudobulk. We drew 100 synthetic bulks per tumor from these pseudobulks, 6,500 in total. We trained one deconvolution model on the 6,500 synthetic bulks.
Cohorts. TransNEO, ARTEMIS (Earl et al., 2015) and PBCP came from the release of Sammut et al. (2022). DFCI IBC is the pretreatment biopsies of GEO GSE207248 (Pernas et al., 2022). We assigned subtype groups from the released ER and HER2 status. We took pathological complete response (pCR) from the released pCR or residual-disease status (DFCI IBC: GEO's response field). We excluded five TransNEO patients without a response label. We kept two TransNEO patients recorded as HER2-negative but treated with trastuzumab in the ER+/HER2− group.
Response model. For each subtype group, we fit an L2-penalized logistic regression of pCR on the 12 standardized class shares in TransNEO (scikit-learn 1.9.1 LogisticRegressionCV). We chose the penalty by 5-fold stratified cross-validation. We applied the model unchanged to the external cohorts and scored each patient by the predicted log-odds.
Other baselines. We used the R/Bioconductor package genefu to compute the surrogates of Oncotype DX (oncotypedx) and MammaPrint (gene70) on \(\log_2(\mathrm{TPM}+1)\) per cohort. All 21 and 52 of their signature genes were mapped. In the HER2+ cohorts, we also used ERBB2 expression as \(\log_2(1+\mathrm{TPM})\).
Ladon performance improves as we scale model size and compute
Advances in contemporary AI come in part from being able to predict how models will improve as we increase model size and training compute. Scaling laws describe how pre-training loss, a measure of error on the model’s training task, decreases with scale. What makes that relationship valuable is when a model that gets better at its training task also gets better at the tasks we ultimately care about (Kaplan et al., 2020).
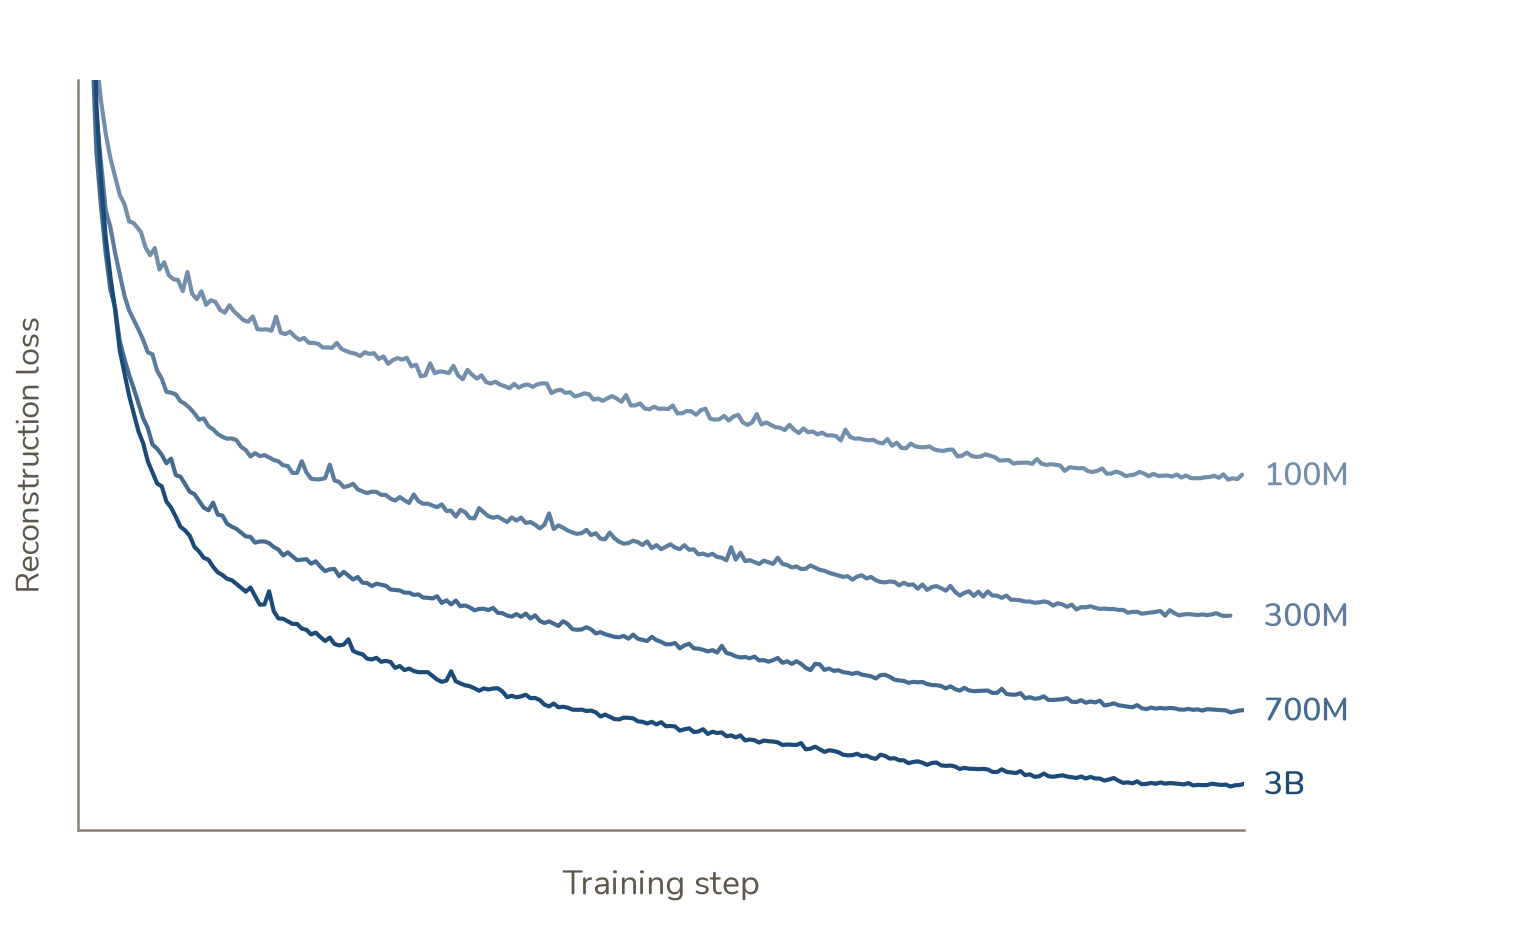
In biological domains especially, acquiring new data is arduous and methodologically complex. Our challenge with Ladon was to find a pre-training task that continues to improve with additional compute and helps the model learn information relevant to patient outcomes. We find that as we scale model size and training length, model pre-training performance continues to improve (Figure 20).
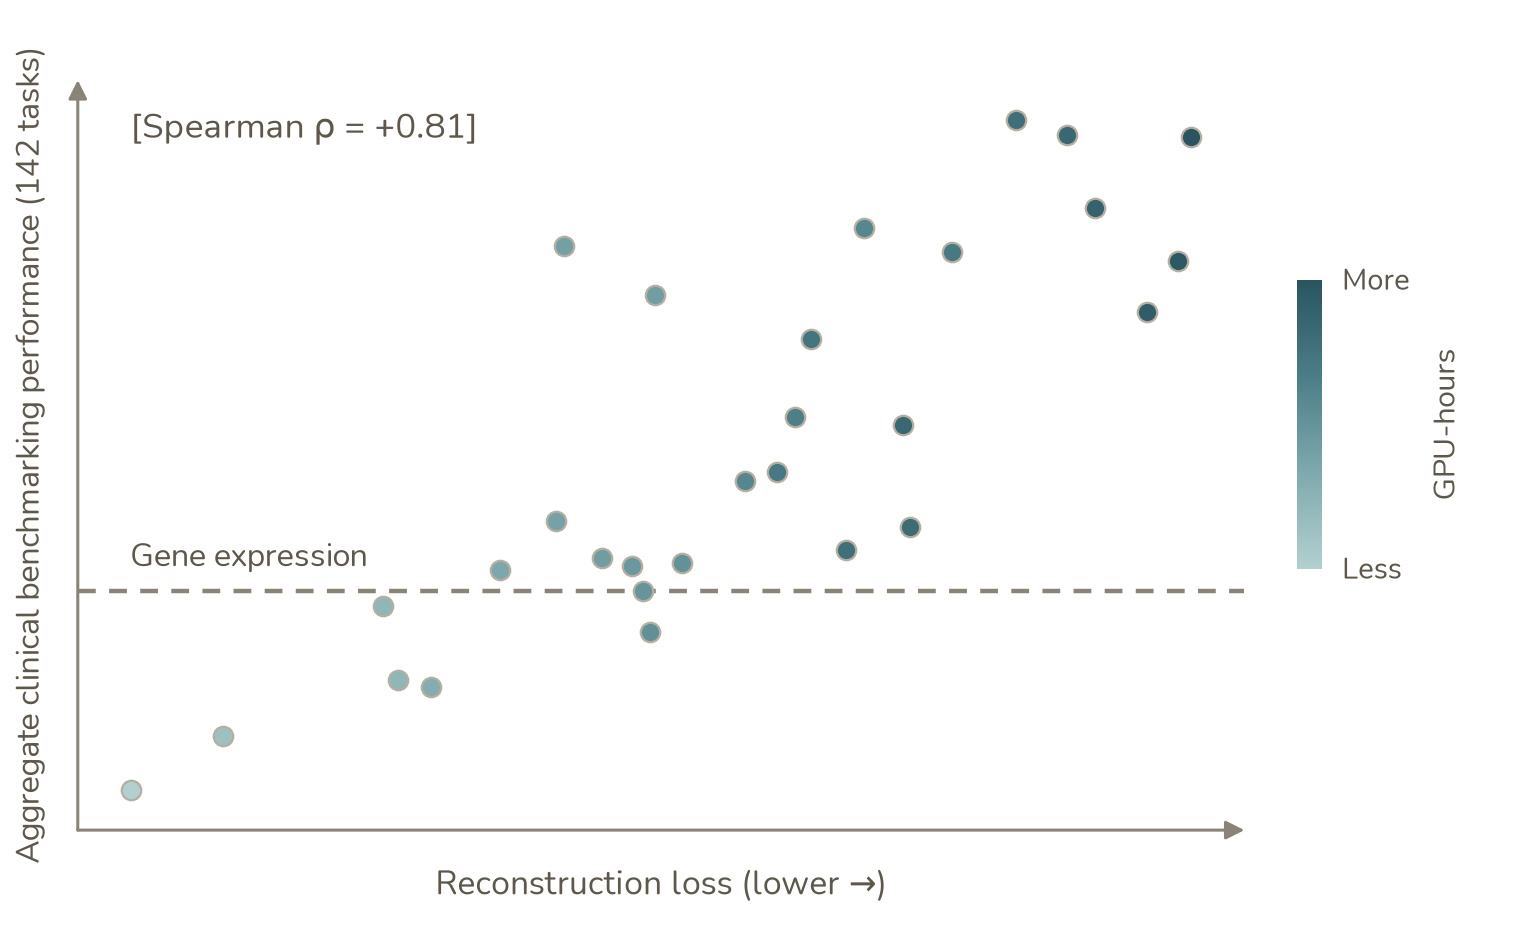
To assess whether a decrease in pre-training loss corresponds to a prediction difference on clinically relevant tasks, we assembled ClinBench, a patient-level benchmark covering survival, treatment response, and patient and tumour characteristics. We aggregate performance across 142 tasks. Each point in the figure shows how a Ladon model performed at a particular step in training: consistent with our intuition that RNA sequencing captures a great deal of information about a patient’s biology, lower reconstruction loss was strongly correlated with better average performance across these tasks (Figures 20, 21).
We believe Ladon is a floor on the performance of foundation models for bulk transcriptomics. Over the past 25 years, public consortia, hospital biobanks, and clinical trials have profiled millions of patient samples. Only a fraction of those profiles are paired with outcomes like survival or response to treatment, but Ladon can learn from RNA even when the outcome is unknown. The scaling results give us a reason to train larger models for longer on more of the biological variation these data already capture.
Methods
Reconstruction loss
We trained Ladon models at different parameter counts and measured reconstruction loss at regular intervals throughout training. Evaluation used a fixed dataset that was excluded from training, with the same evaluation procedure applied across model sizes and checkpoints. We plot reconstruction loss against training step to show how performance changes as training progresses and how this differs with model capacity.
Clinical benchmark
Each point represents a model checkpoint evaluated for both reconstruction and downstream prediction. We used each checkpoint to generate RNA-seq embeddings, then trained separate prediction models on those embeddings. The Ladon model remained frozen throughout this evaluation. Survival tasks used elastic-net Cox models, and classification tasks used logistic regression, with regularization selected by cross-validation within the training data.
The benchmark contains 142 tasks: 85 within-cohort tasks and 57 cross-cohort survival tasks. Within-cohort tasks used three-fold cross-validation repeated five times. For cross-cohort tasks, the prediction model was trained on the other cohorts of the same cancer type and evaluated on the held-out cohort. Survival was scored using Harrell’s concordance index and classification using AUROC. Each held-out cohort counted as a separate task, and the plotted score is the unweighted average across all 142 tasks.
We evaluated four feature representations: raw embeddings, standardized embeddings, and PCA projections to 32 or 64 dimensions. All transformations were fitted using training samples only. For each checkpoint, we report the representation with the highest average benchmark score, which was standardized embeddings for all Ladon checkpoints.
The gene-expression baseline used the same tasks, splits, and prediction models, with log-transformed gene expression as input. Transcript expression was summed to genes and normalized before transformation. The dashed line in Fig. 21 shows the baseline using PCA with 32 components.
Reconstruction loss was obtained using the fixed evaluation procedure described above. Where checkpoint steps fell between logged evaluations, the loss was linearly interpolated between adjacent evaluations. Colour indicates accumulated training GPU-hours, including evaluation and checkpointing time.
Conclusion
In this report, we introduce Ladon and show how it effectively harnesses the biological signal in transcriptomics to make robust predictions of prognosis and treatment response in patients. We believe these are foundational prediction tasks that ground the capabilities needed to unlock clinical trial abundance. We're building towards a future in which we equip drug developers and clinicians with tools like Ladon to run smaller, more efficient trials, with higher success rates. Ultimately, we think it’s important to build on the capabilities that we’ve highlighted today and increasingly shift our ability to de-risk clinical trial decision-making in silico. Over the next few months, this is what we’ll be focused on building. If you’re interested in using the model today and working closely with our team to adapt it to your most pressing problems, please reach out!
References
- Abbas AR et al. Deconvolution of Blood Microarray Data Identifies Cellular Activation Patterns in Systemic Lupus Erythematosus. PLoS ONE 4, e6098 (2009). doi:10.1371/journal.pone.0006098
- Bardia A et al. Trastuzumab Deruxtecan after Endocrine Therapy in Metastatic Breast Cancer. New England Journal of Medicine 391, 2110–2122 (2024). doi:10.1056/NEJMoa2407086
- Benjamini Y, Hochberg Y. Controlling the False Discovery Rate: A Practical and Powerful Approach to Multiple Testing. Journal of the Royal Statistical Society Series B: Statistical Methodology 57, 289–300 (1995). doi:10.1111/j.2517-6161.1995.tb02031.x
- Cancer Genome Atlas Research Network et al. The Cancer Genome Atlas Pan-Cancer analysis project. Nature Genetics 45, 1113–1120 (2013). doi:10.1038/ng.2764
- Chu T et al. Cell type and gene expression deconvolution with BayesPrism enables Bayesian integrative analysis across bulk and single-cell RNA sequencing in oncology. Nature Cancer 3, 505–517 (2022). doi:10.1038/s43018-022-00356-3
- Cox DR. Regression Models and Life-Tables. Journal of the Royal Statistical Society Series B: Statistical Methodology 34, 187–202 (1972). doi:10.1111/j.2517-6161.1972.tb00899.x
- Davis AA, Patel VG. The role of PD-L1 expression as a predictive biomarker: an analysis of all US Food and Drug Administration (FDA) approvals of immune checkpoint inhibitors. Journal for ImmunoTherapy of Cancer 7, 278 (2019). doi:10.1186/s40425-019-0768-9
- DiMasi JA et al. Innovation in the pharmaceutical industry: New estimates of R&D costs. Journal of Health Economics 47, 20–33 (2016). doi:10.1016/j.jhealeco.2016.01.012
- Du W et al. Tertiary lymphoid structures gene signature predicts response to immunotherapy plus chemotherapy in advanced non-small cell lung cancer. Cancer Immunology, Immunotherapy 74, 307 (2025). doi:10.1007/s00262-025-04165-2
- Earl HM et al. Efficacy of neoadjuvant bevacizumab added to docetaxel followed by fluorouracil, epirubicin, and cyclophosphamide, for women with HER2-negative early breast cancer (ARTemis): an open-label, randomised, phase 3 trial. The Lancet Oncology 16, 656–666 (2015). doi:10.1016/S1470-2045(15)70137-3
- Eisenhauer EA et al. New response evaluation criteria in solid tumours: Revised RECIST guideline (version 1.1). European Journal of Cancer 45, 228–247 (2009). doi:10.1016/j.ejca.2008.10.026
- Farahbod M, Pavlidis P. Untangling the effects of cellular composition on coexpression analysis. Genome Research 30, 849–859 (2020). doi:10.1101/gr.256735.119
- FDA (U.S. Food and Drug Administration). Clinical Trial Endpoints for the Approval of Cancer Drugs and Biologics: Guidance for Industry (2018). fda.gov/media/71195
- FDA (U.S. Food and Drug Administration). Adjusting for Covariates in Randomized Clinical Trials for Drugs and Biological Products: Guidance for Industry (2023a). fda.gov/media/148910
- FDA (U.S. Food and Drug Administration). Considerations for the Design and Conduct of Externally Controlled Trials for Drug and Biological Products: Draft Guidance for Industry (2023b). fda.gov/media/164960
- Fehrenbacher L et al. Atezolizumab versus docetaxel for patients with previously treated non-small-cell lung cancer (POPLAR): a multicentre, open-label, phase 2 randomised controlled trial. The Lancet 387, 1837–1846 (2016). doi:10.1016/S0140-6736(16)00587-0
- Fernandez AI et al. Examination of Low ERBB2 Protein Expression in Breast Cancer Tissue. JAMA Oncology 8, 607 (2022). doi:10.1001/jamaoncol.2021.7239
- Frasca F et al. Insulin Receptor Isoform A, a Newly Recognized, High-Affinity Insulin-Like Growth Factor II Receptor in Fetal and Cancer Cells. Molecular and Cellular Biology 19, 3278–3288 (1999). doi:10.1128/MCB.19.5.3278
- Gélard M et al. BulkRNABert: Cancer prognosis from bulk RNA-seq based language models. Proceedings of the 4th Machine Learning for Health Symposium, PMLR 259, 384–400 (2025). proceedings.mlr.press/v259/gelard25a
- Gendoo DMA et al. Genefu: an R/Bioconductor package for computation of gene expression-based signatures in breast cancer. Bioinformatics 32, 1097–1099 (2016). doi:10.1093/bioinformatics/btv693
- Giroux NS et al. Differential chromatin accessibility in peripheral blood mononuclear cells underlies COVID-19 disease severity prior to seroconversion. Scientific Reports 12, 11714 (2022). doi:10.1038/s41598-022-15668-8
- Golub TR et al. Molecular Classification of Cancer: Class Discovery and Class Prediction by Gene Expression Monitoring. Science 286, 531–537 (1999). doi:10.1126/science.286.5439.531
- GTEx Consortium et al. The GTEx Consortium atlas of genetic regulatory effects across human tissues. Science 369, 1318–1330 (2020). doi:10.1126/science.aaz1776
- Hanley JA, McNeil BJ. The meaning and use of the area under a receiver operating characteristic (ROC) curve. Radiology 143, 29–36 (1982). doi:10.1148/radiology.143.1.7063747
- Huuki-Myers LA et al. Benchmark of cellular deconvolution methods using a multi-assay dataset from postmortem human prefrontal cortex. Genome Biology 26, 88 (2025). doi:10.1186/s13059-025-03552-3
- Iwai T et al. Both T cell priming in lymph node and CXCR3-dependent migration are the key events for predicting the response of atezolizumab. Scientific Reports 11, 13912 (2021). doi:10.1038/s41598-021-93113-y
- Jain RK. Normalization of Tumor Vasculature: An Emerging Concept in Antiangiogenic Therapy. Science 307, 58–62 (2005). doi:10.1126/science.1104819
- Kagda MS et al. Data navigation on the ENCODE portal. Nature Communications 16, 9592 (2025). doi:10.1038/s41467-025-64343-9
- Kang H et al. A Comprehensive Benchmark of Transcriptomic Biomarkers for Immune Checkpoint Blockades. Cancers 15, 4094 (2023). doi:10.3390/cancers15164094
- Kang B et al. BulkFormer: A large-scale foundation model for bulk transcriptomes. Cell Systems 17, 101657 (2026). doi:10.1016/j.cels.2026.101657
- Kaplan EL, Meier P. Nonparametric Estimation from Incomplete Observations. Journal of the American Statistical Association 53, 457–481 (1958). doi:10.1080/01621459.1958.10501452
- Kaplan J et al. Scaling Laws for Neural Language Models. arXiv (2020). arXiv:2001.08361
- Leek JT et al. Tackling the widespread and critical impact of batch effects in high-throughput data. Nature Reviews Genetics 11, 733–739 (2010). doi:10.1038/nrg2825
- Li Y et al. Proteogenomic data and resources for pan-cancer analysis. Cancer Cell 41, 1397–1406 (2023). doi:10.1016/j.ccell.2023.06.009
- McGranahan N, Swanton C. Clonal Heterogeneity and Tumor Evolution: Past, Present, and the Future. Cell 168, 613–628 (2017). doi:10.1016/j.cell.2017.01.018
- Modi S et al. Trastuzumab Deruxtecan in Previously Treated HER2-Low Advanced Breast Cancer. New England Journal of Medicine 387, 9–20 (2022). doi:10.1056/NEJMoa2203690
- Moller DE et al. Tissue-Specific Expression of Two Alternatively Spliced Insulin Receptor mRNAs in Man. Molecular Endocrinology 3, 1263–1269 (1989). doi:10.1210/mend-3-8-1263
- Monaco G et al. RNA-Seq Signatures Normalized by mRNA Abundance Allow Absolute Deconvolution of Human Immune Cell Types. Cell Reports 26, 1627–1640.e7 (2019). doi:10.1016/j.celrep.2019.01.041
- Newman AM et al. Robust enumeration of cell subsets from tissue expression profiles. Nature Methods 12, 453–457 (2015). doi:10.1038/nmeth.3337
- Newman AM et al. Determining cell type abundance and expression from bulk tissues with digital cytometry. Nature Biotechnology 37, 773–782 (2019). doi:10.1038/s41587-019-0114-2
- Nie X, Wager S. Quasi-oracle estimation of heterogeneous treatment effects. Biometrika 108, 299–319 (2021). doi:10.1093/biomet/asaa076
- Pagès F et al. International validation of the consensus Immunoscore for the classification of colon cancer: a prognostic and accuracy study. The Lancet 391, 2128–2139 (2018). doi:10.1016/S0140-6736(18)30789-X
- Paik S et al. A Multigene Assay to Predict Recurrence of Tamoxifen-Treated, Node-Negative Breast Cancer. New England Journal of Medicine 351, 2817–2826 (2004). doi:10.1056/NEJMoa041588
- Patil NS et al. Intratumoral plasma cells predict outcomes to PD-L1 blockade in non-small cell lung cancer. Cancer Cell 40, 289–300.e4 (2022). doi:10.1016/j.ccell.2022.02.002
- Pernas S et al. Early on-treatment transcriptional profiling as a tool for improving pathological response prediction in HER2-positive inflammatory breast cancer. Therapeutic Advances in Medical Oncology 14, 17588359221113269 (2022). doi:10.1177/17588359221113269
- Powles T et al. Atezolizumab versus chemotherapy in patients with platinum-treated locally advanced or metastatic urothelial carcinoma (IMvigor211): a multicentre, open-label, phase 3 randomised controlled trial. The Lancet 391, 748–757 (2018). doi:10.1016/S0140-6736(17)33297-X
- Qu J et al. TabICLv2: A better, faster, scalable, and open tabular foundation model. Proceedings of the 43rd International Conference on Machine Learning, PMLR 306, 102477–102555 (2026). proceedings.mlr.press/v306/qu26a
- Racle J et al. Simultaneous enumeration of cancer and immune cell types from bulk tumor gene expression data. eLife 6, e26476 (2017). doi:10.7554/eLife.26476
- Rosenberg JE et al. Atezolizumab in patients with locally advanced and metastatic urothelial carcinoma who have progressed following treatment with platinum-based chemotherapy: a single-arm, multicentre, phase 2 trial. The Lancet 387, 1909–1920 (2016). doi:10.1016/S0140-6736(16)00561-4
- Sammut SJ et al. Multi-omic machine learning predictor of breast cancer therapy response. Nature 601, 623–629 (2022). doi:10.1038/s41586-021-04278-5
- Straussman R et al. Tumour micro-environment elicits innate resistance to RAF inhibitors through HGF secretion. Nature 487, 500–504 (2012). doi:10.1038/nature11183
- Tsai FD et al. K-Ras4A splice variant is widely expressed in cancer and uses a hybrid membrane-targeting motif. Proceedings of the National Academy of Sciences 112, 779–784 (2015). doi:10.1073/pnas.1412811112
- Tsoucas D et al. Accurate estimation of cell-type composition from gene expression data. Nature Communications 10, 2975 (2019). doi:10.1038/s41467-019-10802-z
- Tumeh PC et al. PD-1 blockade induces responses by inhibiting adaptive immune resistance. Nature 515, 568–571 (2014). doi:10.1038/nature13954
- Uno H et al. On the C‐statistics for evaluating overall adequacy of risk prediction procedures with censored survival data. Statistics in Medicine 30, 1105–1117 (2011). doi:10.1002/sim.4154
- van 't Veer LJ et al. Gene expression profiling predicts clinical outcome of breast cancer. Nature 415, 530–536 (2002). doi:10.1038/415530a
- Wu SZ et al. A single-cell and spatially resolved atlas of human breast cancers. Nature Genetics 53, 1334–1347 (2021). doi:10.1038/s41588-021-00911-1
- Xu L et al. A comprehensive single-cell breast tumor atlas defines epithelial and immune heterogeneity and interactions predicting anti-PD-1 therapy response. Cell Reports Medicine 5, 101511 (2024). doi:10.1016/j.xcrm.2024.101511
- Youngblut ND et al. scBaseCount: An AI agent-curated, standardized, auto-updated single-cell data repository. Cell 189, 5932–5944.e6 (2026). doi:10.1016/j.cell.2026.08.025
- Zheng GXY et al. Massively parallel digital transcriptional profiling of single cells. Nature Communications 8, 14049 (2017). doi:10.1038/ncomms14049
Byeon GW, Fradkin P, Hsu J, Nguyen V, Shi I, Tu W, Zhang M. Ladon: An RNA Foundation Model for Predicting Patient Outcomes. Blank Bio (2026). https://doi.org/10.5281/zenodo.24157116
@techreport{byeon2026ladon,
  title = {Ladon: An {RNA} Foundation Model for Predicting Patient Outcomes},
  author = {Byeon, Gun Woo and Fradkin, Philip and Hsu, Jonathan and Nguyen, Viet and Shi, Ian and Tu, Wilson and Zhang, Michael},
  institution = {Blank Bio},
  year = {2026},
  month = nov,
  doi = {10.5281/zenodo.24157116},
  url = {https://doi.org/10.5281/zenodo.24157116}
}
Overview figure by Visual Cinnamon.